As an Envato author, you have access to a lot of data about your sales and earnings. But with so much data available, it can be difficult to know where to start and how to use it to improve your business. That's where our Envato sales and earnings chart generator comes in.
Our tool makes it easy to generate charts that show you the number of sales and earnings for your items, by month and country, for any given year and date range. This information can be used to identify trends, set goals, and track your progress.
Here are just a few of the ways that our Envato sales and earnings chart generator can help you:
Identify your best-performing items and countries.
Identify seasonal trends.
Track your progress towards your goals.
Make informed decisions about your business.
Screenshots
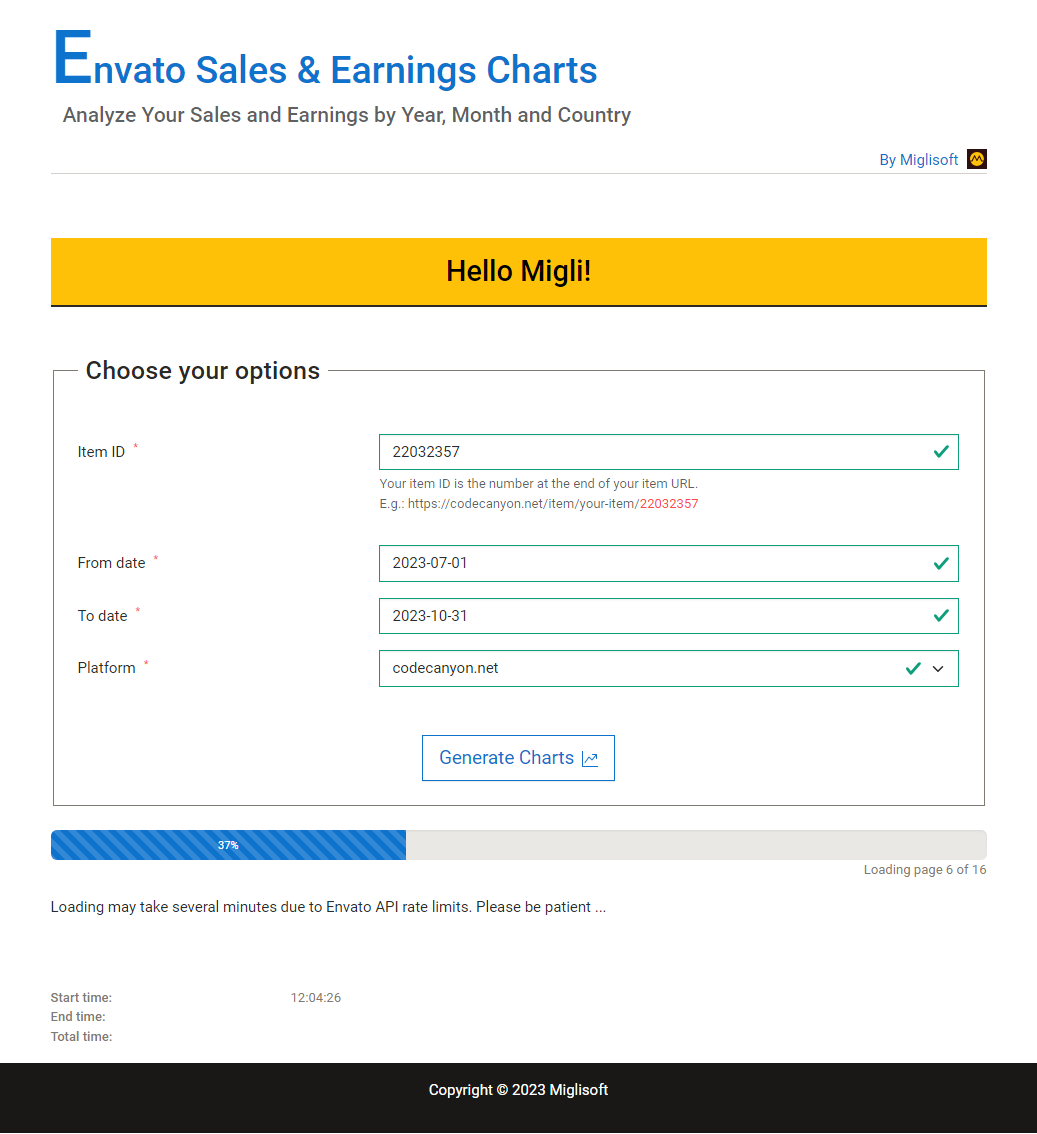
How to use our Envato Sales & Earnings Charts
Enter your Envato API client ID and client secret then submit the form.
The Envato Authorization form opens. Click the "Approve" button to authorize the application to connect with your account.
The Options form opens.
Enter your item ID
Select the start date and end date for the date range that you want to analyze.
Select the Envato platform that the item belongs to.
Click the "Generate Chart" button.
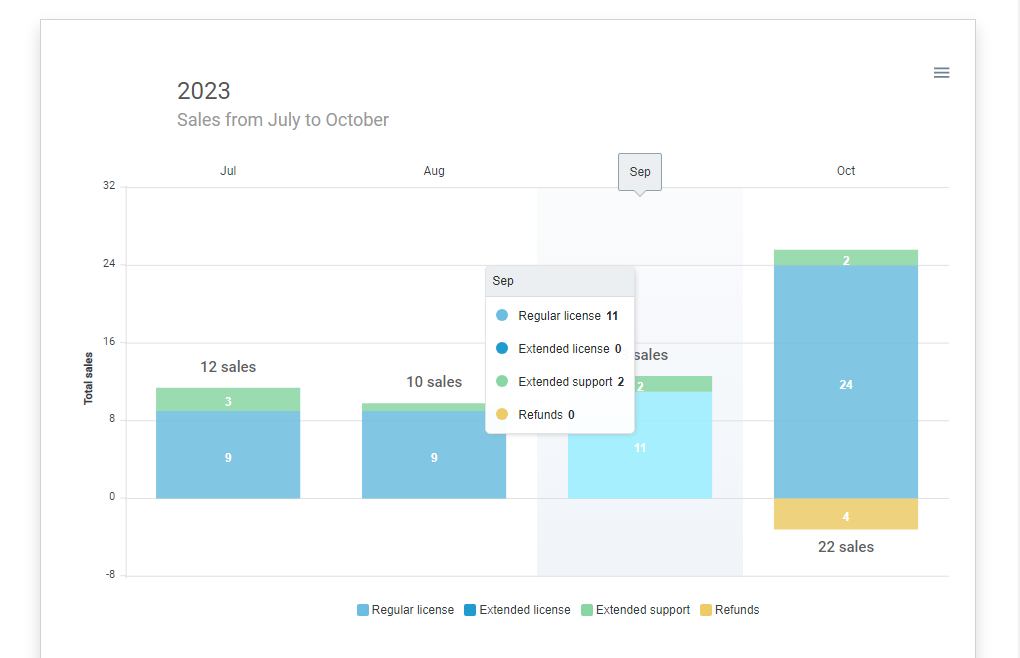
The tool will then generate three charts for each year within the selected date range:
A chart that shows the number of sales by month for the selected item.
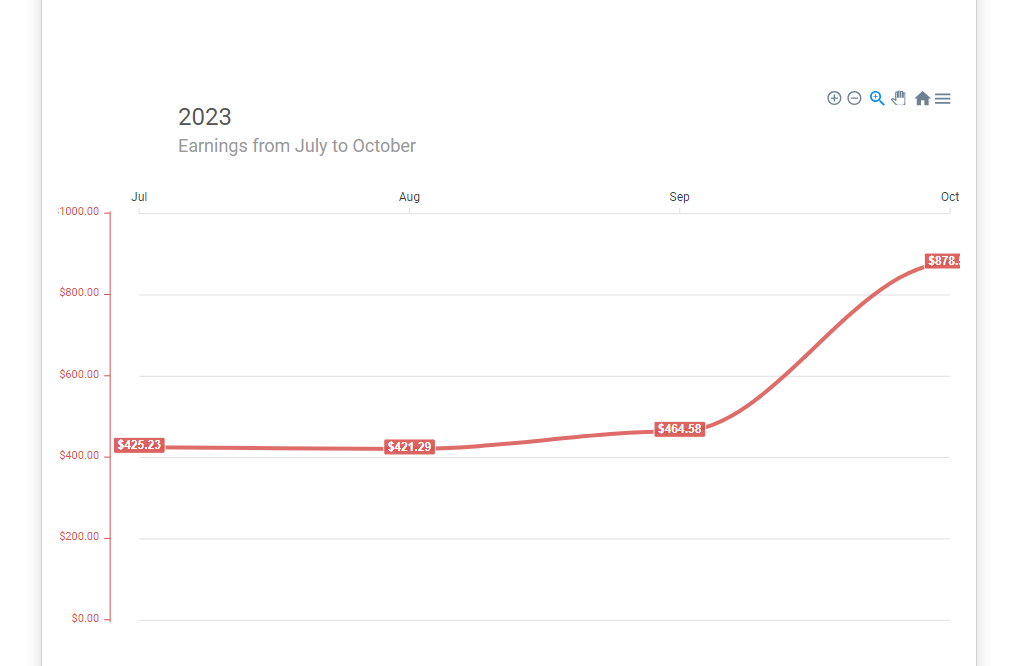
A chart that shows the earnings by month for the selected item.
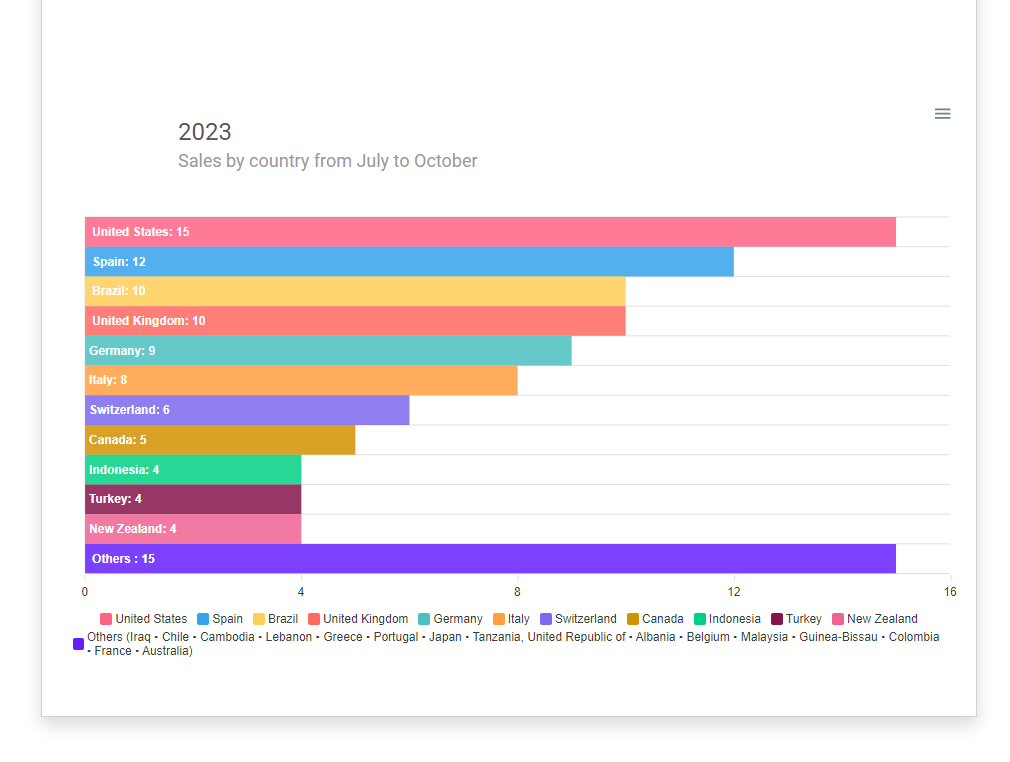
A chart that shows the number of sales by country for the selected item, for the selected year.
You can use these charts to identify trends, set goals, and track your progress. For example, you could use the charts to see which of your items are selling the most, which countries are driving the most sales, and how your sales and earnings fluctuate throughout the year.
By understanding your sales and earnings data, by month and country, for the selected date range, you can make informed decisions about your business, such as what new items to create, which platforms to focus on, and how to price your items.